Interpreting blood biomarkers: Ferritin and GGT as measures of inflammation and oxidative stress
By Dr. Chris Spooner, ND
Features Patient Care Research Wellness bloodwork inflammation stress
“I feel terrible, but my blood work says everything is normal and that there’s nothing wrong.”
Patients appreciate it when you can help them makes sense of their contradiction, and in my experience, the interpretation of blood work is one area they find enormously frustrating.
They expect results to explain their symptoms (fatigue, weight gain, pain, inflammation, hormone imbalance, etc). The challenge is that physicians often consider patients “healthy” or “normal” when results are within the normal standard lab reference range, even when the “unwell” patient feels far from “normal.”
In this article, I’d like to discuss how to talk to patients about what these results represent, and use ferritin and GGT as examples of two common tests that can provide more insight than is what’s commonly used for inflammation and oxidative stress.
Why does this happen?
First, let’s start with a review of what exactly standard reference ranges (SRR) are. SRR’s are a statistical analysis and represent a distribution of results according to populations. (Opposite page.)
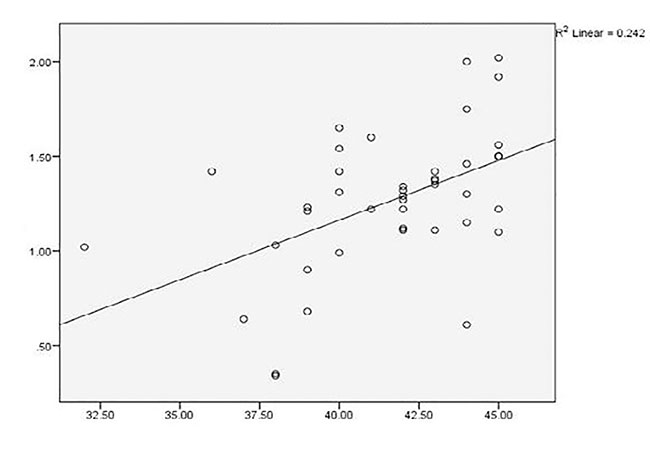
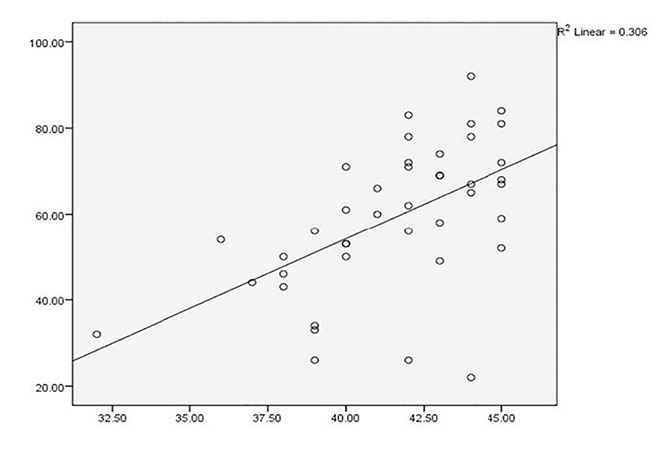
I refer to this as “medicine by average,” and while there is great utility in understanding the larger associations and trends, these may not apply to an individual. Take a look at the data on page 20, looking at alkaline phosphatase as an indicator of zinc and magnesium deficiency.i
The authors concluded that “a significant decrease in Zn and Mg level in our group of cases suggest(ed) the fact that, ALP is a Zn containing metallo-enzyme and Mg is an important promoter of ALP…. There is a positive correlation between Zn and Alkaline phosphatase in these groups signifying the fact that Zn raises the activities of alkaline phosphatases, particularly of bone. ALP activity is not only important for increase in its activity, but it is also important for decrease in its activity. Zn and Mg deficiency are the most important causes of low ALP activity.”
However, look at how many points are actually on the line and the proportion of how many points are above and below. There are several individuals where this is clearly not the case and high ALP exists in the presence of significant zinc and magnesium deficiency (red boxes).
So, it’s important to recognize that SRRs represent a distribution of results according to statistical analysis, not physiological function. There is seldom a “universally applicable” reference value as population averages and ranges show variability according to geography and the lab used to run the test, with normal ranges shifting as with the health of the population tested (i.e., gets younger or older, get sicker, more obese, more CVD, etc).
Cerottiii noted that 93 laboratories in Italy, all claiming to use standard procedure testing ALT, had upper reference limits for adult males spanning from 40 U/L to 72 U/L, while the lower limit ranged from 0 U/L to 30 U/L. They concluded that: “This common situation is dangerous and misleading both for clinicians and patients (the same analytical result can be considered ‘normal’ in one laboratory and ‘abnormal’ in another, according to the reference interval in use).” ALT is an important marker for measuring liver damage and is commonly used to monitor liver damage associated with numerous medications.
This leads to a situation where standard reference ranges are basically showing you what’s average and not optimal and where the test may not be sensitive enough to detect disease early and only detect overt pathology once the damage is done.
To summarize, the “standard” approach is using laboratory results as guideposts for diagnosing and monitoring disease where “out of range” results indicate the presence of a disease or condition associated with the biomarker and “within range” results indicate the absence of disease – the absence of disease is synonymous with “health.”
Consequently, a more pragmatic approach is needed, and health should be judged subjectively as the absence of signs of disease specifically related to the measurand. Reviewing that same blood work in a context of “optimal ranges” may demonstrate that the patient is far from “normal” by looking at a narrower range of where results are associated with optimal health not just the absence of disease, can detect early changes and trends away from optimal function, and provide an opportunity to further explore and assess potential dysfunction before it progresses to disease.
This is obviously a very large topic, and many integrative clinicians are currently using the optimal range approach, TSH testing is the most obvious case I can think of. However, I find I am using this approach much more frequently with ferritin and GGT so will lay out the case for each of these tests.
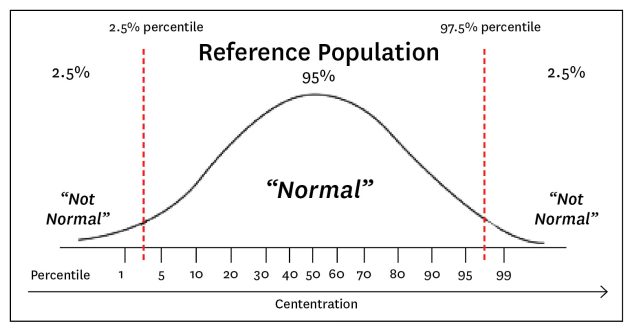
A review of what Standard Reference Ranges are.
Ferritin
Serum ferritin levels are widely measured as indicators of iron status. In clinical practice, I see low ferritin ben used to justify iron supplementation. Even in the context of normal RBC counts, hematocrit, and mean corpuscular volume. When it is elevated, the most interpretation is hemochromatosis and therapy involves monitoring of liver enzymes and, if significantly elevated, phlebotomy.
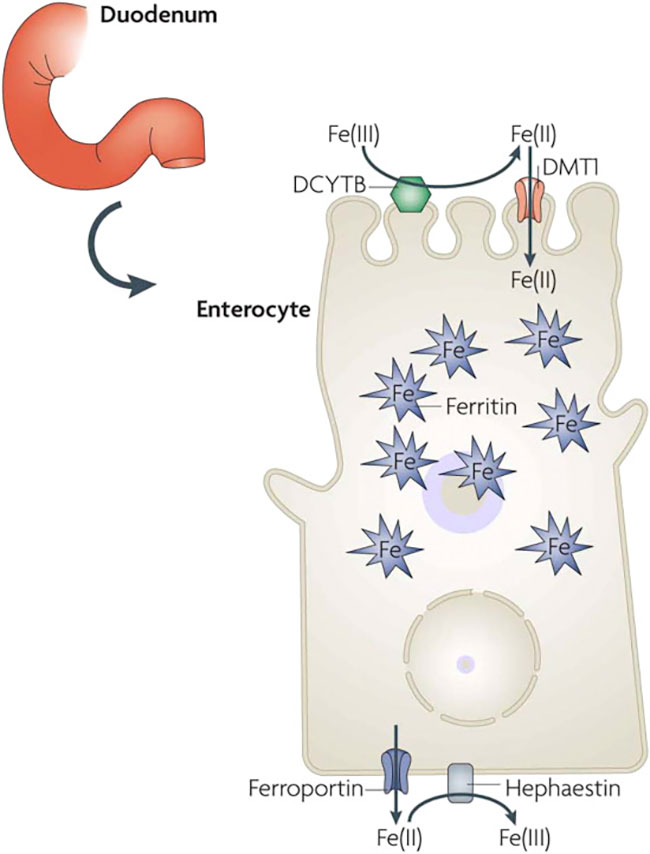
To review, ferric (+3) salts and ions are poorly water-soluble and much of the complex (redox) chemistry of iron in the body is designed to deal with this.iii Iron is absorbed in the intestine as ferrous (+2) ions and transported in the serum bound (in the ferric form, +3) to transferrin, where it can enter peripheral tissues via suitable receptors, being re-reduced in the process (See page 21).iv
However, “serum ferritin” presents a paradox, as the ironv storage protein ferritin is not synthesized in serum yet is found there. Ferritin is supposed to be a cellular means of storing iron not of transporting it, yet serum ferritin levels are widely measured as indicators of iron status.
A study of iron deficiency in female athletesvi found that even though serum iron levels of athletes were higher, serum ferritin levels were lower than in control subjects and physical activity study with 1743 Finnish men, the duration and frequency of physical activity were associated inversely with serum ferritin and blood hemoglobin.vii
Ferritin is the necessary protein that binds iron to stop its otherwise exceptional reactivity, specifically the production of the very damaging hydroxyl radical that reacts in nanoseconds with the nearest biological substances making it especially dangerous.viii Thus, while iron is vital for living processes, there is an exceptionally important need to sequester iron in a suitably liganded form, and cellular ferritin is a major means of doing this.
Serum ferritin is also a well-known inflammatory marker and levels can be raised significantly in response to inflammation and/or a variety of diseases. It appears that serum ferritin reflects or causes inflammation, and that serum ferritin arises from damaged cells, and is thus a marker of cellular damage. The protein in serum ferritin is considered benign, but it has lost (i.e. dumped) most of its normal complement of iron which when unliganded is highly toxic.
In this context, it would be prudent to re-evaluate ferritin and iron status in the context of other functional markers. For low ferritin RBC, Hematocrit, Hemoglobin, MCHC and MCV should be considered.ix In cases of elevated ferritin, recall that serum ferritin likely originates from cell leakage and that there is a correlation between serum aspartate aminotransferase (a marker of hepatocellular damage) and SF. Serum alanine aminotransferase is another well-known marker of liver damage that correlates with serum ferritin, consistent with the view that serum ferritin is indeed a marker of damaged cells.x Looking at ferritin in this context opens up numerous options for therapy such as antioxidant support and hepatic support.
Ray et al., Curr. Res. Nutr Food Sci Jour., Vol. 5(3), 347-352 (2017)
Stankiewicz, J. M., Neema, M. & Ceccarelli, A. Iron and multiple sclerosis. Neurobiol Aging 35, S51–S58 (2014).
Gamma Glutamyl Transferase (GGT)
Gamma-glutamyltransferase (GGT) is a well-established serum marker for alcohol-related liver disease. I have seen many patients come in with an elevated GGT and have been told by their physician to reduce or stop their alcohol consumption. This is often a significant source of frustration as most of them are not consuming excessive amounts. GGT data has been collected by the life insurance industry for many years. Their principal reason for measuring GGT levels was the ability to mark alcohol abuse or risky drinking behaviour in life insurance applicants. When high GGT levels were found in life insurance candidates, premium policy pricing or even application rejection often resulted.xi
Although gamma-glutamyl compounds include antioxidants, inflammatory molecules, drug metabolites, and reactive compounds, the major function of GGT is enabling metabolism of the antioxidant glutathione and is a marker for glutathione depletion in the liver. Elevations in GGT reflect increased exposure to organic xenobiotics that are metabolized in the liver through glutathionylation.xii
Elevations in GGT can be seen in conditions well beyond liver disease: Elevated GGT is linked to increased risk to a multitude of diseases and conditions, including cardiovascular disease, diabetes, metabolic syndrome (MetS), and all-cause mortalityxiii Changes in GGT concentrations have been reported in a wide variety of clinical conditions, including pancreatic disease, myocardial infarction, renal failure, chronic obstructive pulmonary disease, diabetes, and alcoholism.xiv Liver function tests (principally GGT and ALP), hypocholesterolemia, proteinuria, and low fructosamine were found to be independently predictive of cancer mortality. GGT-ALP ranked highest for predicting mortality risks for all men in age groups 18 through 59 years. For women, GGT-ALP was ranked first for those aged 30 through 59, and second behind urine protein and urine creatinine for ages between 60 and 79 years.xv
Palmier and Lanzrathxi calculated a hazard ratio (HR) curve for males with an increasing HR trend starting at about 0.70 to 0.80 for GGT between approximately 15 U/L and 20 U/L that became a fairly flat curve between GGT levels of approximately 45 U/L to 85 U/L.
The lowest GGT-related risk quartiles were less than 16 U/L for men and 10 U/L for women. Above these reference levels, increasing GGT levels translated to increased risks for each outcome studied and reached statistical significance for CHD mortality among men with GGT levels above the male median level of 24 U/L
For women, CHD mortality risk reached a significant HR of 1.65 with GGT of 20–32 U/L. Threshold GGT levels at which higher CHD mortality risk became significant for both men and women were GGT 16–24 U/L
A large Austrian study also demonstrated an approximate doubling of HRs between low to high GGT levels for cancer mortality.xvi
Summary
This article was not intended to be an exhaustive review of optimal values for blood values or clinical interpretation of them, but to demonstrate the limitations of the standard approach to assessing blood work and encourage the reader to consider a more nuanced and individualized approach.
There are numerous resources for exploring the interrelationships between biomarkers and functional blood chemistry analysis. Some examples include:
- Intermountain Risk Score: https://intermountainhealthcare.org/IMRS/
- MediCalc: http://www.scymed.com/en/smnxab/smnxabaa.htm
- The Medical Algorithm Company: https://www.medicalalgorithms.com/
- Health & Medical Calculators: https://www.thecalculator.co
- OPTIMAL Dx: https://www.optimaldx.com/
Using basic blood chemistry can be a familiar, low cost approach to functional medicine testing that can help you and your patients make informed choices. The key is recognizing the inherent weakness in reference ranges ie. population vs individual, and understanding the pathophysiology of the marker being tested.
REFERENCES:
- Ray, C. S., Singh, B., Jena, I., Behera, S. & Ray, S. Low Alkaline Phosphatase (ALP) In Adult Population an Indicator of Zinc (Zn) and Magnesium (Mg) Deficiency. Curr Res Nutrition Food Sci J 5, 347–352 (2017)
- Ceriotti, F., Hinzmann, R. & Panteghini, M. Reference intervals: the way forward. Ann Clin Biochem 46, 8–17 (2008).
- Kell, D. B. & Pretorius, E. Serum ferritin is an important inflammatory disease marker, as it is mainly a leakage product from damaged cells. Metallomics 6, (2014).
- Stankiewicz, J. M., Neema, M. & Ceccarelli, A. Iron and multiple sclerosis. Neurobiol Aging 35, S51–S58 (2014).
- Arosio, P., Ingrassia, R. & Cavadini, P. Ferritins: A family of molecules for iron storage, antioxidation and more. Biochimica Et Biophysica Acta Bba – Gen Subj 1790, 589–599 (2009).
- Kim, S. H., Kim, H. Y. P., Kim, W. K. & Park, O. J. Nutritional status, iron-deficiency-related indices, and immunity of female athletes. Nutrition 18, 86–90 (2002).
- Karamizrak, S. O. et al. Evaluation of iron metabolism indices and their relation with physical work capacity in athletes. Brit J Sport Med 30, 15 (1996).
- Liu, X. & Theil, E. C. Ferritins: Dynamic Management of Biological Iron and Oxygen Chemistry. Accounts Chem Res 38, 167–175 (2005).
- Steinberg, J. D. & Olver, C. S. Hematologic and biochemical abnormalities indicating iron deficiency are associated with decreased reticulocyte hemoglobin content (CHr) and reticulocyte volume (rMCV) in dogs. Vet Clin Path 34, 23–27 (2005).
- Kell, D. B. & Pretorius, E. Serum ferritin is an important inflammatory disease marker, as it is mainly a leakage product from damaged cells. Metallomics 6, (2014).
- Palmier J, Lanzrath BJ. Laboratory and biometric predictors of cancer-related mortality in an insured population. J Insur Med. 2012;43(3) 162-168. PMID: 23451617.
- Wickham, S., West, M. B., Cook, P. F. & Hanigan, M. H. Gamma-glutamyl compounds: Substrate specificity of gamma-glutamyl transpeptidase enzymes. Anal Biochem 414, 208–214 (2011).
- J. B. Whitfield (2001) Gamma Glutamyl Transferase, Critical Reviews in Clinical Laboratory Sciences, 38:4, 263-355, DOI: 10.1080/20014091084227
- Kazemi-Shirazi, L. et al. Gamma Glutamyltransferase and Long-Term Survival: Is It Just the Liver? Clin Chem 53, 940–946 (2007).
- Palmier, J. & Lanzrath, B. J. Laboratory and biometric predictors of cancer-related mortality in an insured population. J Insur Medicine New York N Y 43, 162–8 (2012).
- Kazemi-Shirazi, L. et al. Gamma Glutamyltransferase and Long-Term Survival: Is It Just the Liver? Clin Chem 53, 940–946 (2007).
Dr. Chris Spooner ND, B.Sc. is a North Okanagan naturopathic doctor with 20 years of clinical experience. In his private practice, Paradigm Integrative Medicine, Dr. Spooner works with patients looking for a balanced approach to health care that combines conventional medicine with research informed integrative approaches. Dr. Spooner has advanced certifications through the College of Naturopathic Physicians of B.C., including prescriptive authority. He has been a board member and vice chair of the College of Naturopathic Physicians of British Columbia since 2008.
Print this page